
The Advance/Decline Line (A/D) is an important financial indicator that can provide valuable insight into the health of the stock market. It is a technical analysis tool used to measure the number of stocks that are advancing compared to the number of stocks that are declining in a given index. By tracking the A/D Line, investors can gain an understanding of market sentiment and identify potential buying and selling opportunities. This article will explain what the Advance/Decline Line is, how it is calculated, and how it can be used to your advantage as an investor.
What is the Advance/Decline Line (A/D) and How Does it Impact the Financial Market?
The Advance/Decline Line (A/D) is an important technical indicator used to measure the performance of the stock market. It is calculated by subtracting the number of stocks declining from the number advancing. A positive A/D line indicates that the market is generally going up while a negative A/D line indicates the market is generally going down. The A/D line can help investors identify potential buying and selling opportunities by showing them when the market is trending up or down. This indicator can also be used to confirm the strength of a trend, as when the A/D line is diverging from the price of the underlying index, it can be an indication that the trend is weakening. The A/D line is a valuable tool for investors looking to make informed decisions about when to enter or exit the market. By monitoring the A/D line, investors can better understand the direction of the market and make better-informed decisions about when to buy and sell.
Understanding the Different Types of Advance/Decline Lines (A/D) and How They Can Help Investors Make Better Decisions
Understanding the different types of Advance/Decline Lines (A/D) and how they can help investors make better decisions is key to successful trading. A/D lines, also known as breadth indicators, measure the number of stocks advancing or declining in a particular market index. Generally, when the A/D line is rising, it is a sign of strength in the market and is a bullish indicator. Conversely, when the A/D line is falling, it is a sign of weakness in the market and is a bearish indicator. By using A/D lines, investors can identify market trends and anticipate changes in the stock market. They can also help investors identify periods of overbuying or overselling, allowing them to take advantage of potential opportunities or avoid potential losses. A/D lines are an important tool that can help investors make better decisions and improve their trading performance.
Analyzing Advance/Decline Lines (A/D) to Predict Market Trends
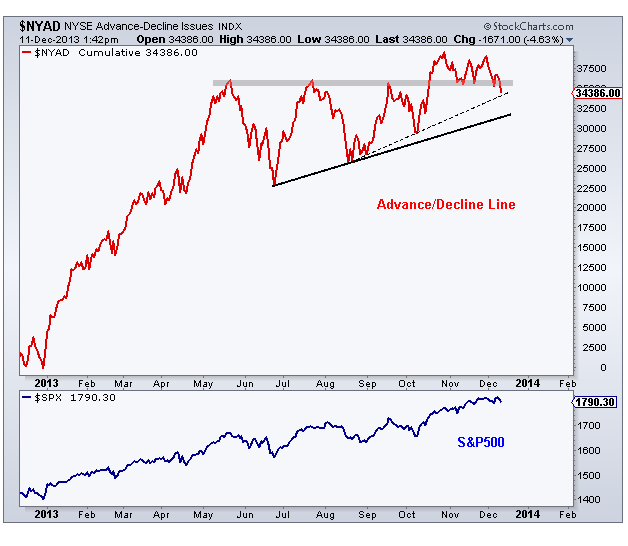
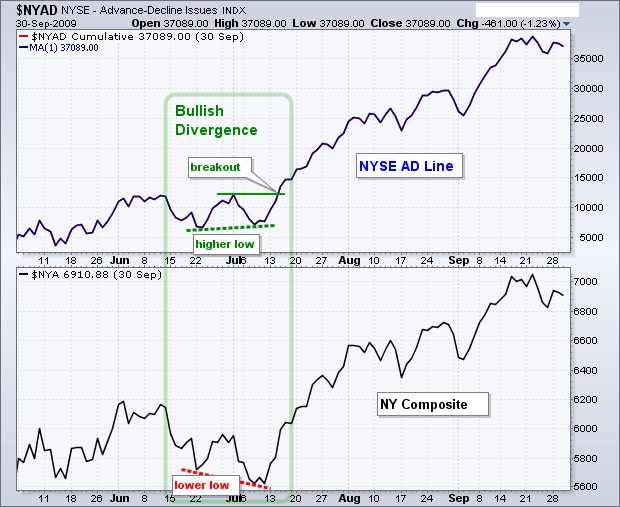
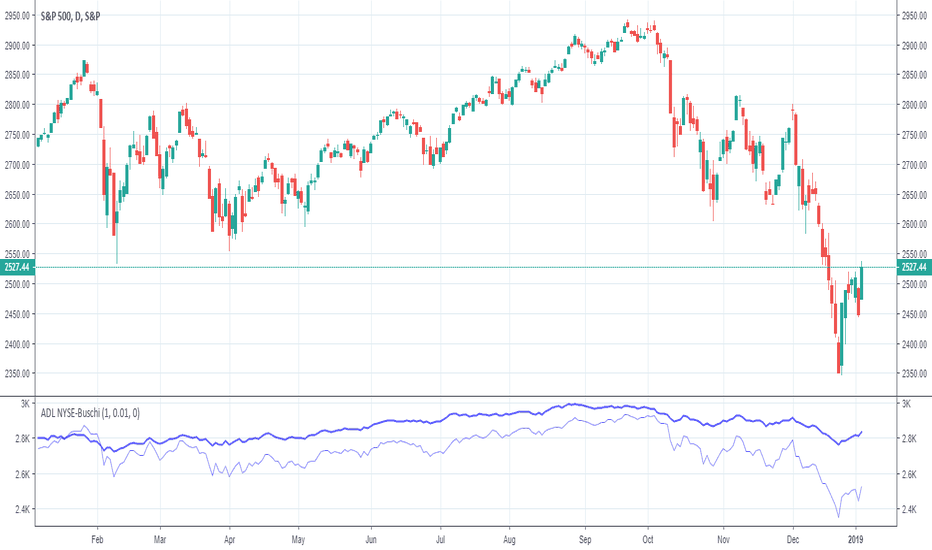
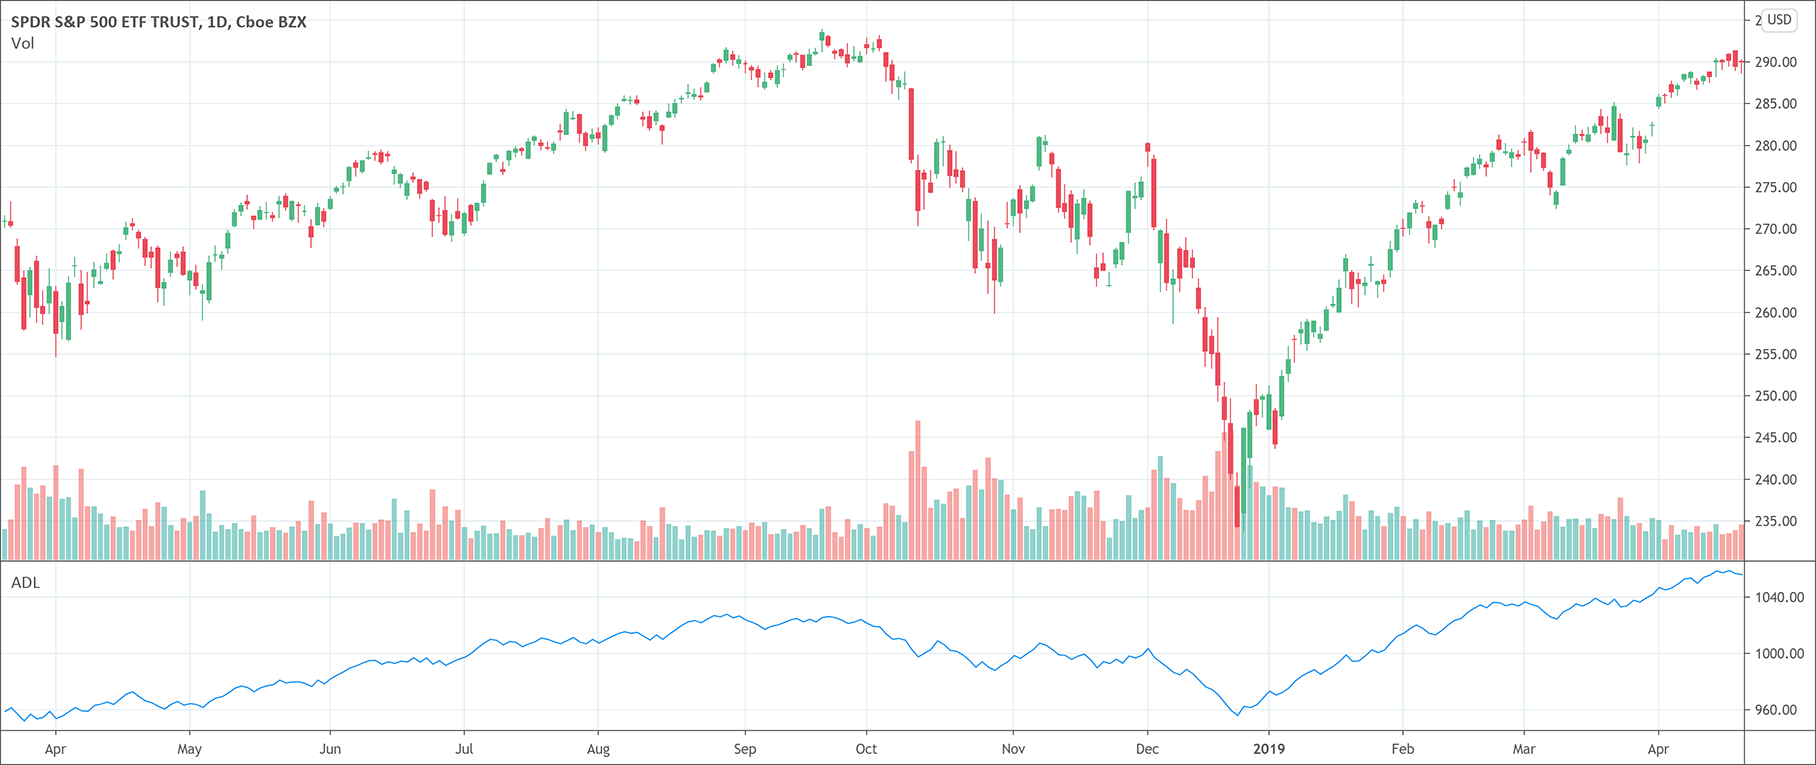
Analyzing Advance/Decline Lines (A/D) is a great way to predict where the stock market is headed. A/D lines measure the number of advancing stocks minus the number of declining stocks over a period of time. By looking at the A/D line, traders can get a better idea of whether the market is in an uptrend, downtrend, or is range-bound. A/D Lines can also be used to spot divergences between the market price and the A/D line. When the market is rising, but the A/D line is falling, it is a sign that the rally is losing strength and could be a warning sign of a possible reversal. Conversely, when the market is falling, but the A/D line is rising, it could be a sign of a possible trend reversal. By analyzing the A/D line, traders can gain valuable insight into the current market trend and can use this information to make better trading decisions.
Exploring the Advantages of Advance/Decline Lines (A/D) for Equity Investors
Advance/Decline Lines (A/D) are a great tool for equity investors to use to track the health of the stock market. A/D lines measure the number of stocks that are advancing compared to those that are declining, allowing investors to get an idea of the overall market sentiment. By tracking the A/D line, investors can gain insight into the direction of the market and make more informed decisions about their investments. The A/D line is seen as a leading indicator of market trends and can give investors an early warning of potential opportunities or risks in the market. This can help investors make better decisions about when to buy and sell, as well as give them the ability to time their investments for maximum returns. With the help of the A/D line, investors can gain a deeper understanding of the stock market and make more successful long-term investments.
How to Interpret Advance/Decline Lines (A/D) for Maximum Profit Potential
If you’re looking to maximize your profit potential, you need to understand how to interpret the Advance/Decline Line (A/D). A/D is a technical indicator that tracks the number of stocks advancing versus declining on the stock market. It is a great tool for analyzing overall market trends, as well as individual stocks. By analyzing the A/D line, you can get a better understanding of the current market sentiment, as well as predict future market trends. You can use the A/D line to identify when to buy or sell stocks and when to stay out of the market altogether. Additionally, if you are an active trader, the A/D line can be used to create a trading strategy that will help you take advantage of market movements and maximize your profit potential. With the right knowledge, the Advance/Decline Line (A/D) can be a powerful tool in your trading arsenal.